EventWatch Reports
Fluency has the ability to generate Reports/Dashboards based on aggregations from Event Watch.
Login to the Fluency Cloud portal: https://companyname.cloud.fluencysecurity.com.
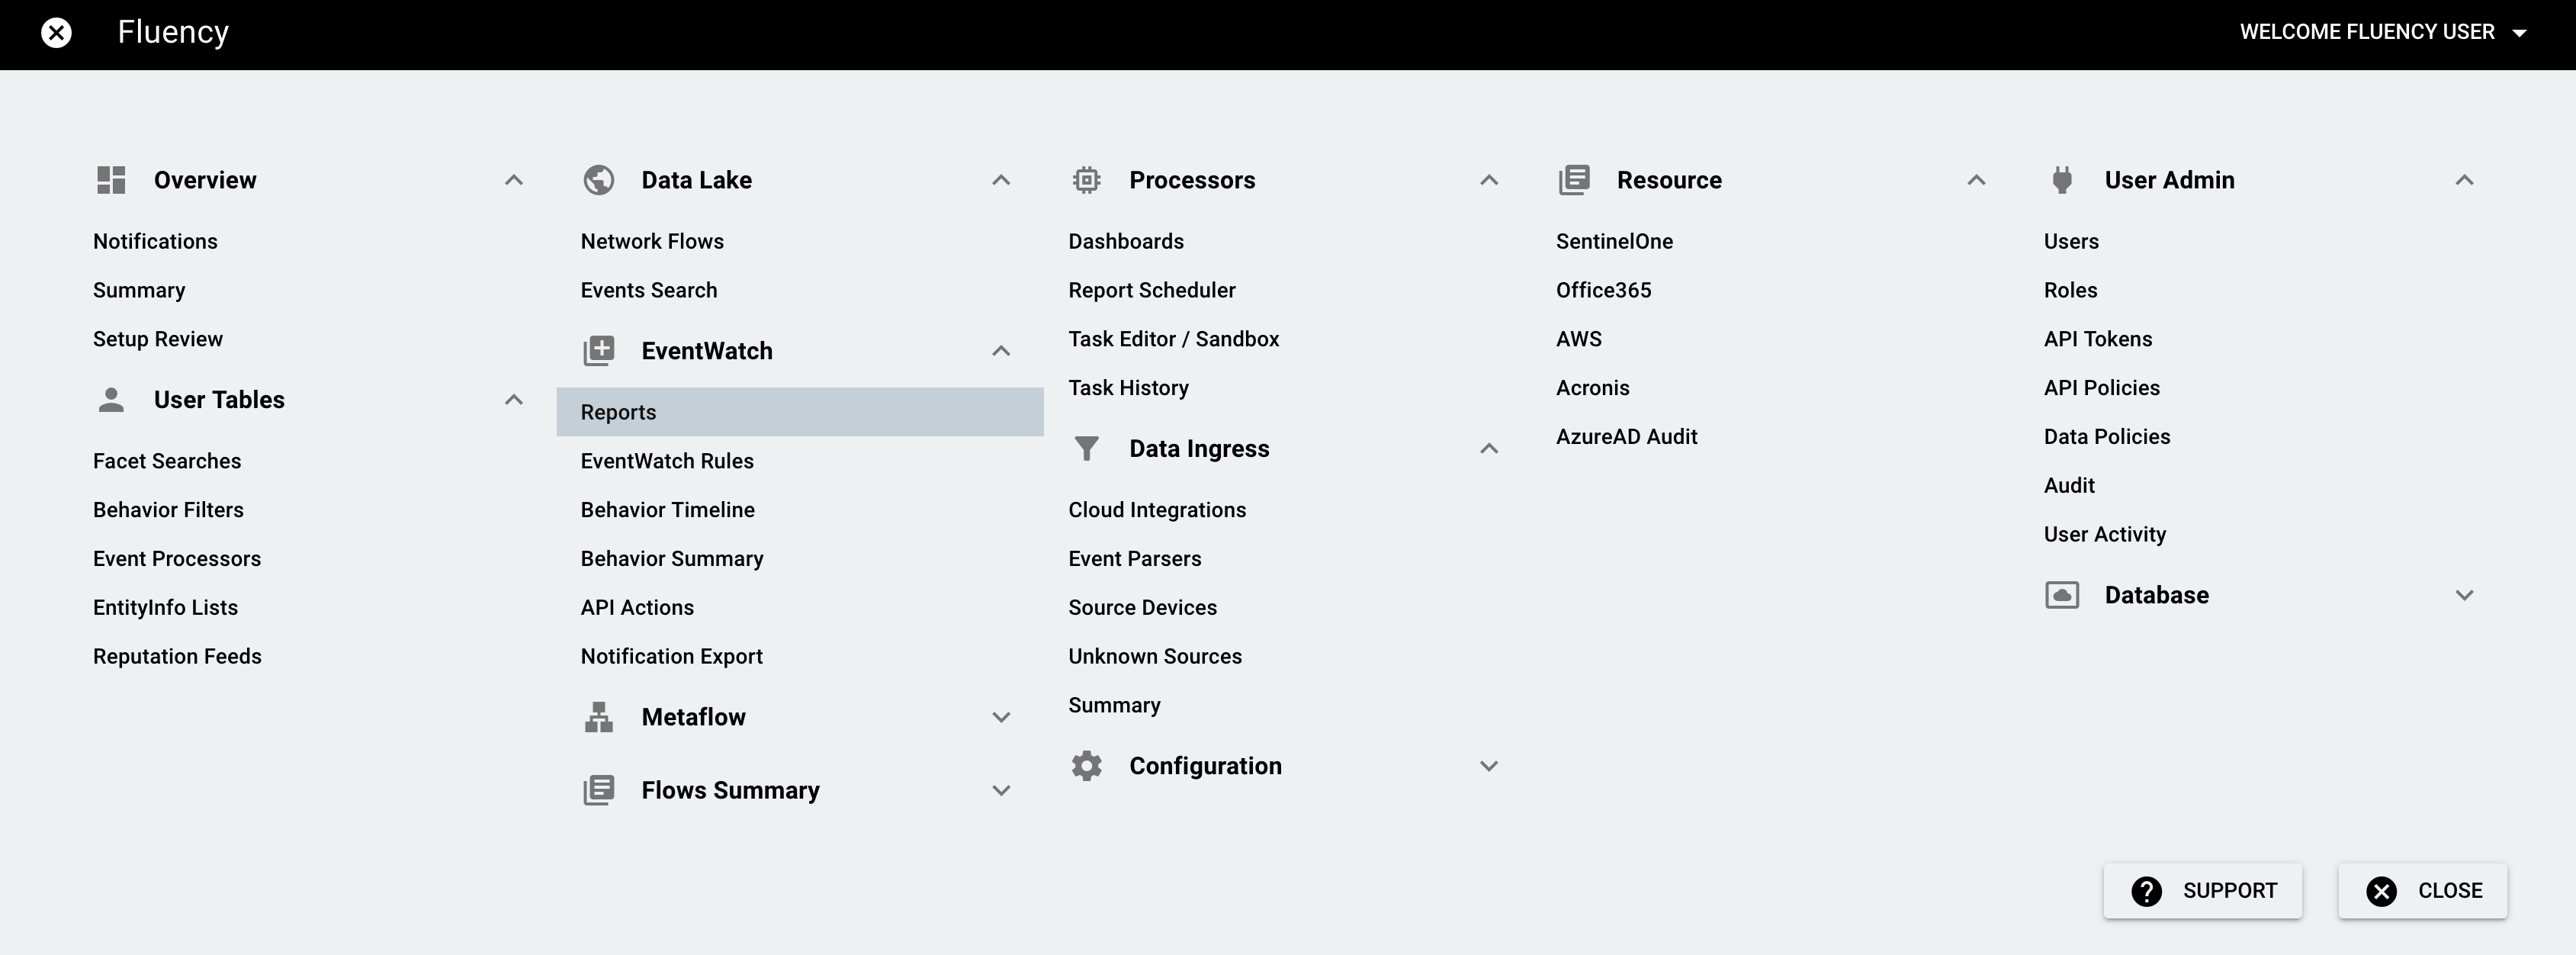
Open the main dropdown menu and choose the Report option under the EventWatch section.
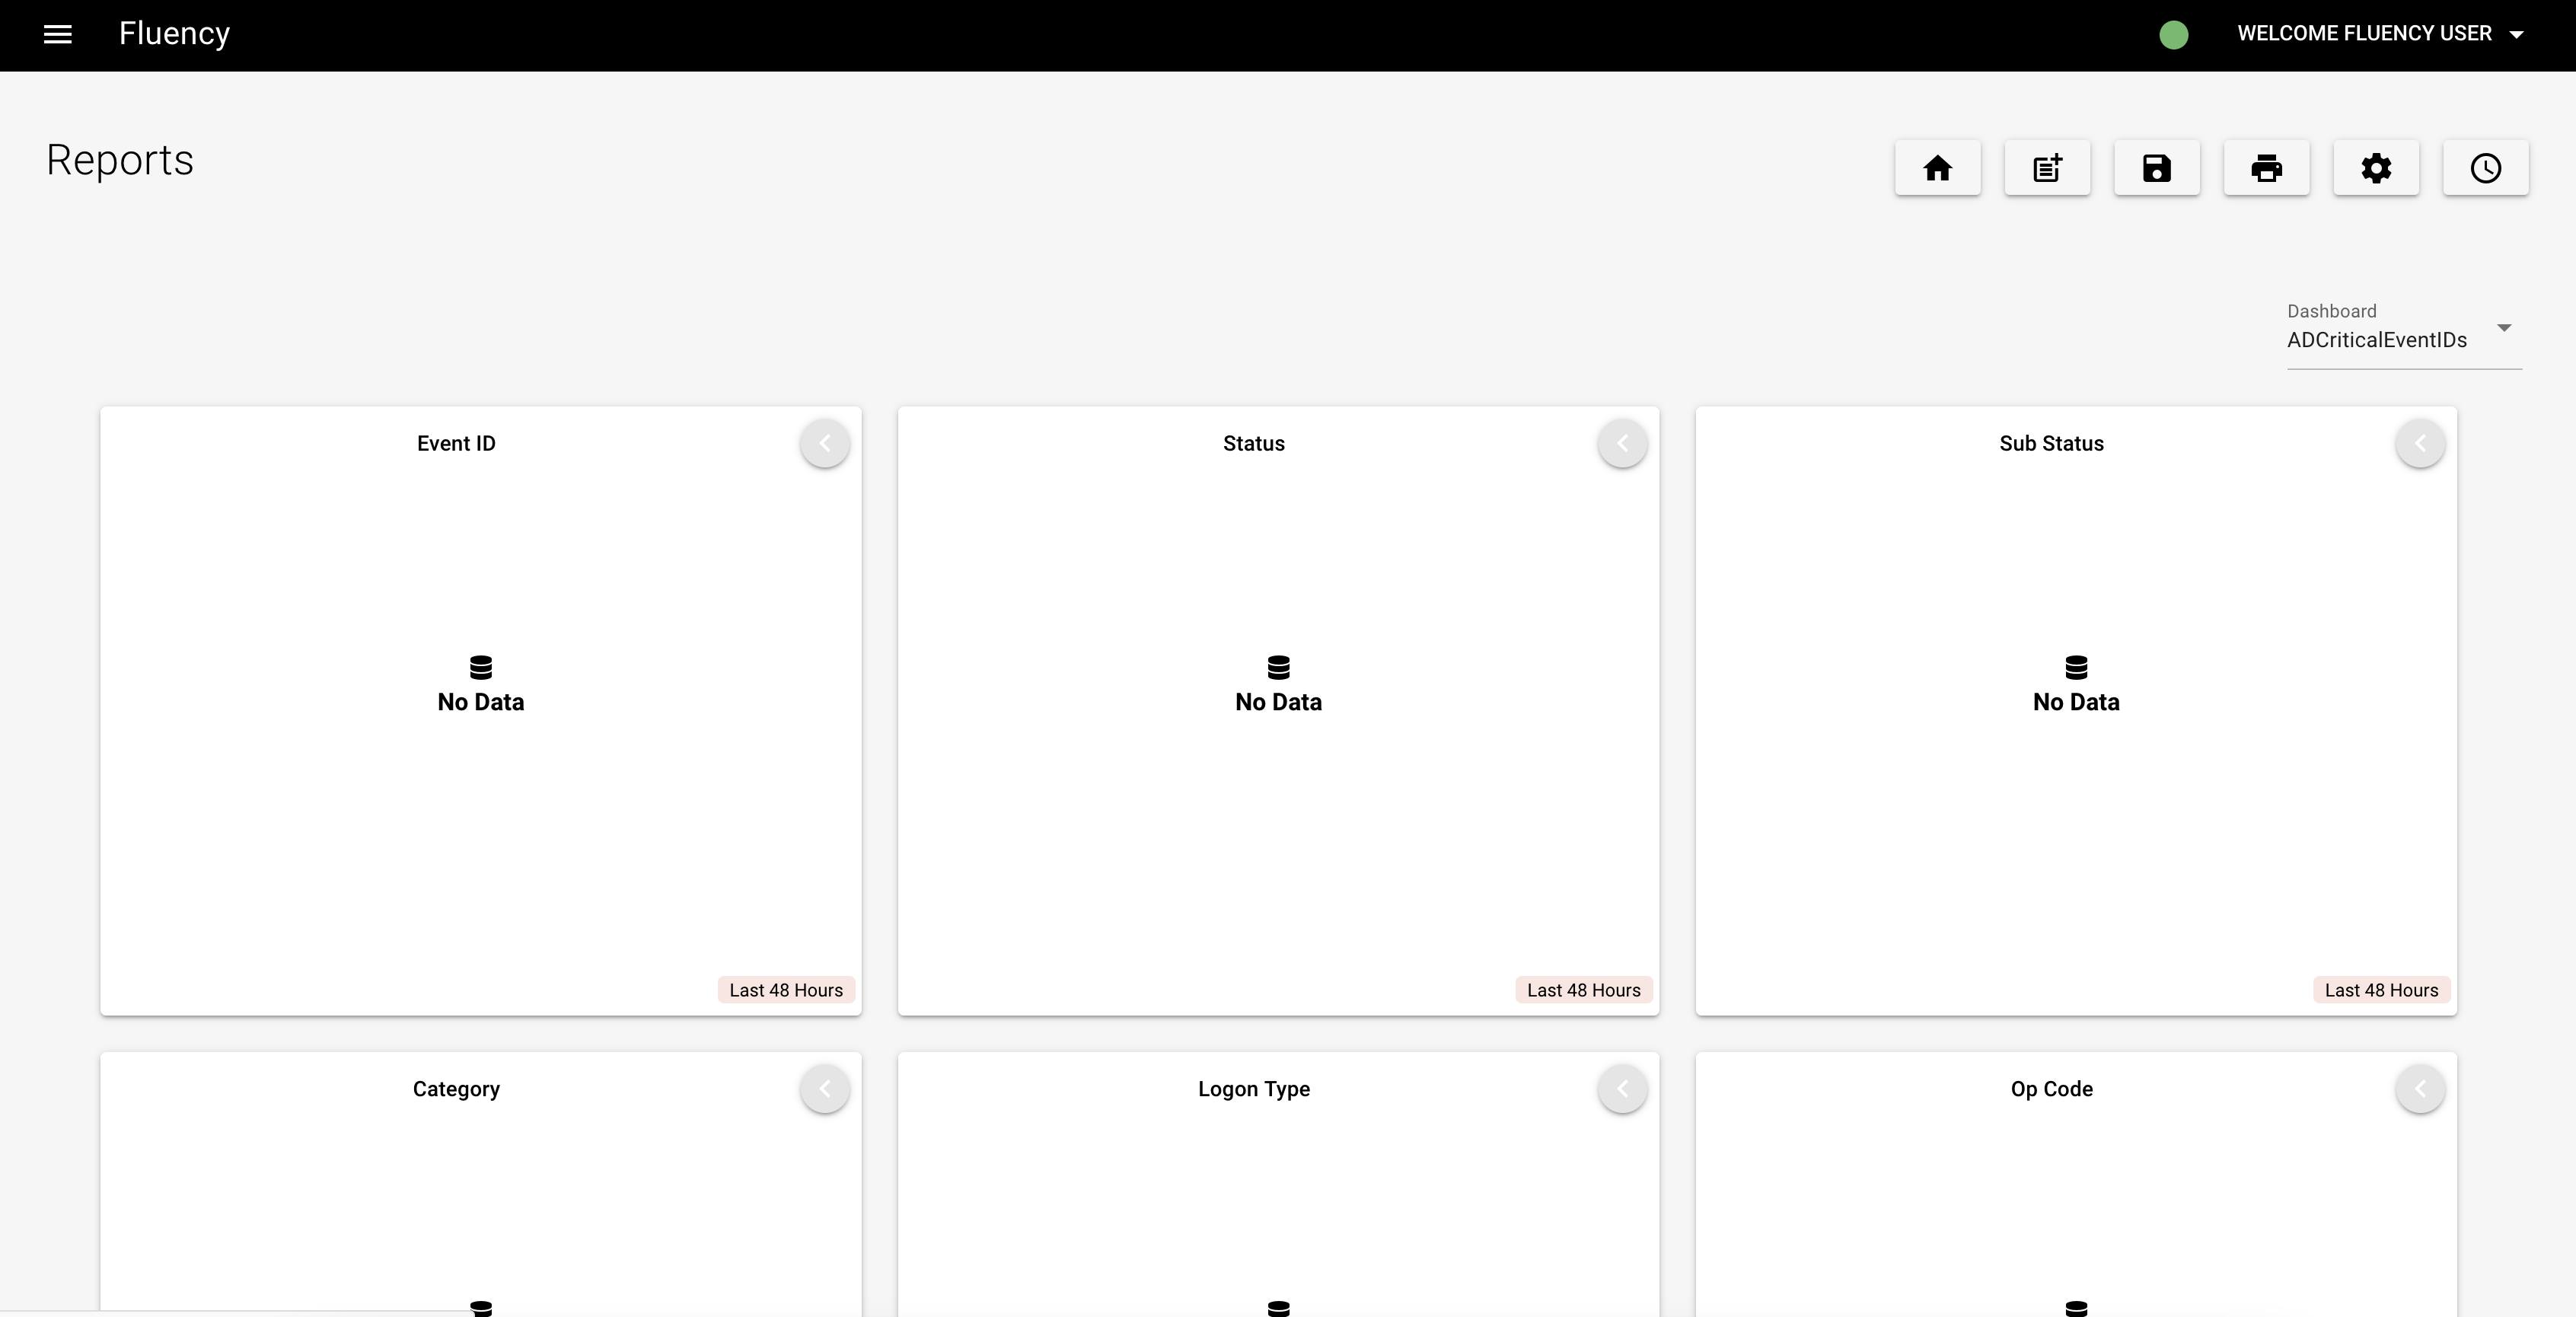
The existing reports are shown. Click the “Dashboard” on the right side of the page, in the drop-down menu, switch to the report you’d like to show.
Adding a EventWatch Report
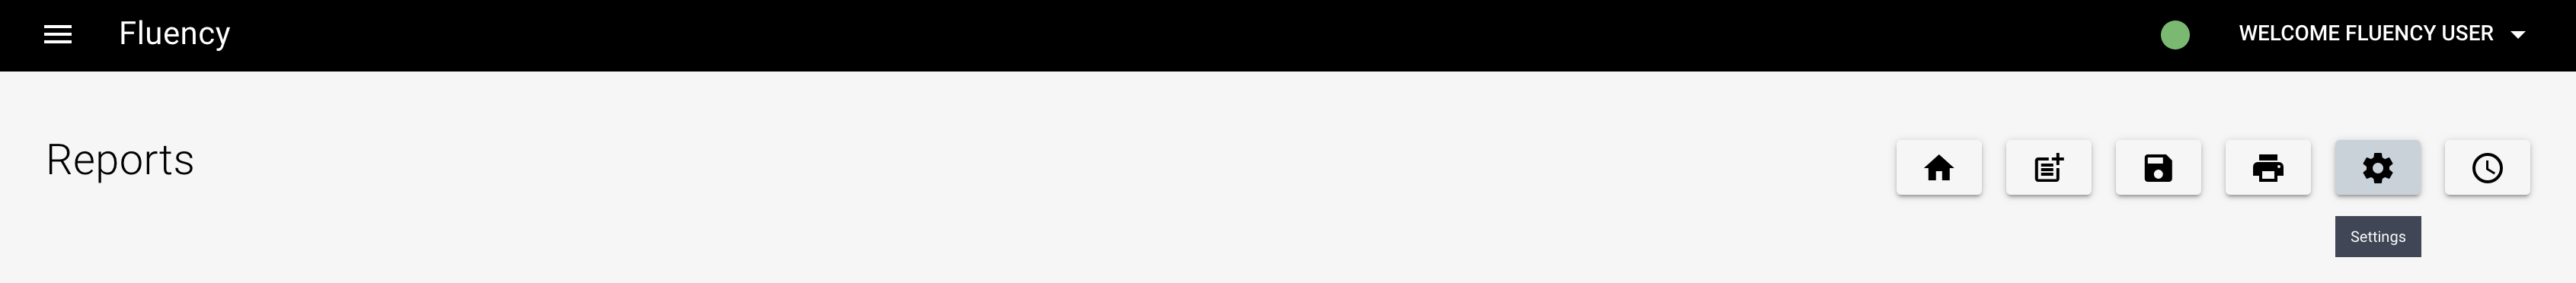
Click the gear icon to navigate to the setting page.
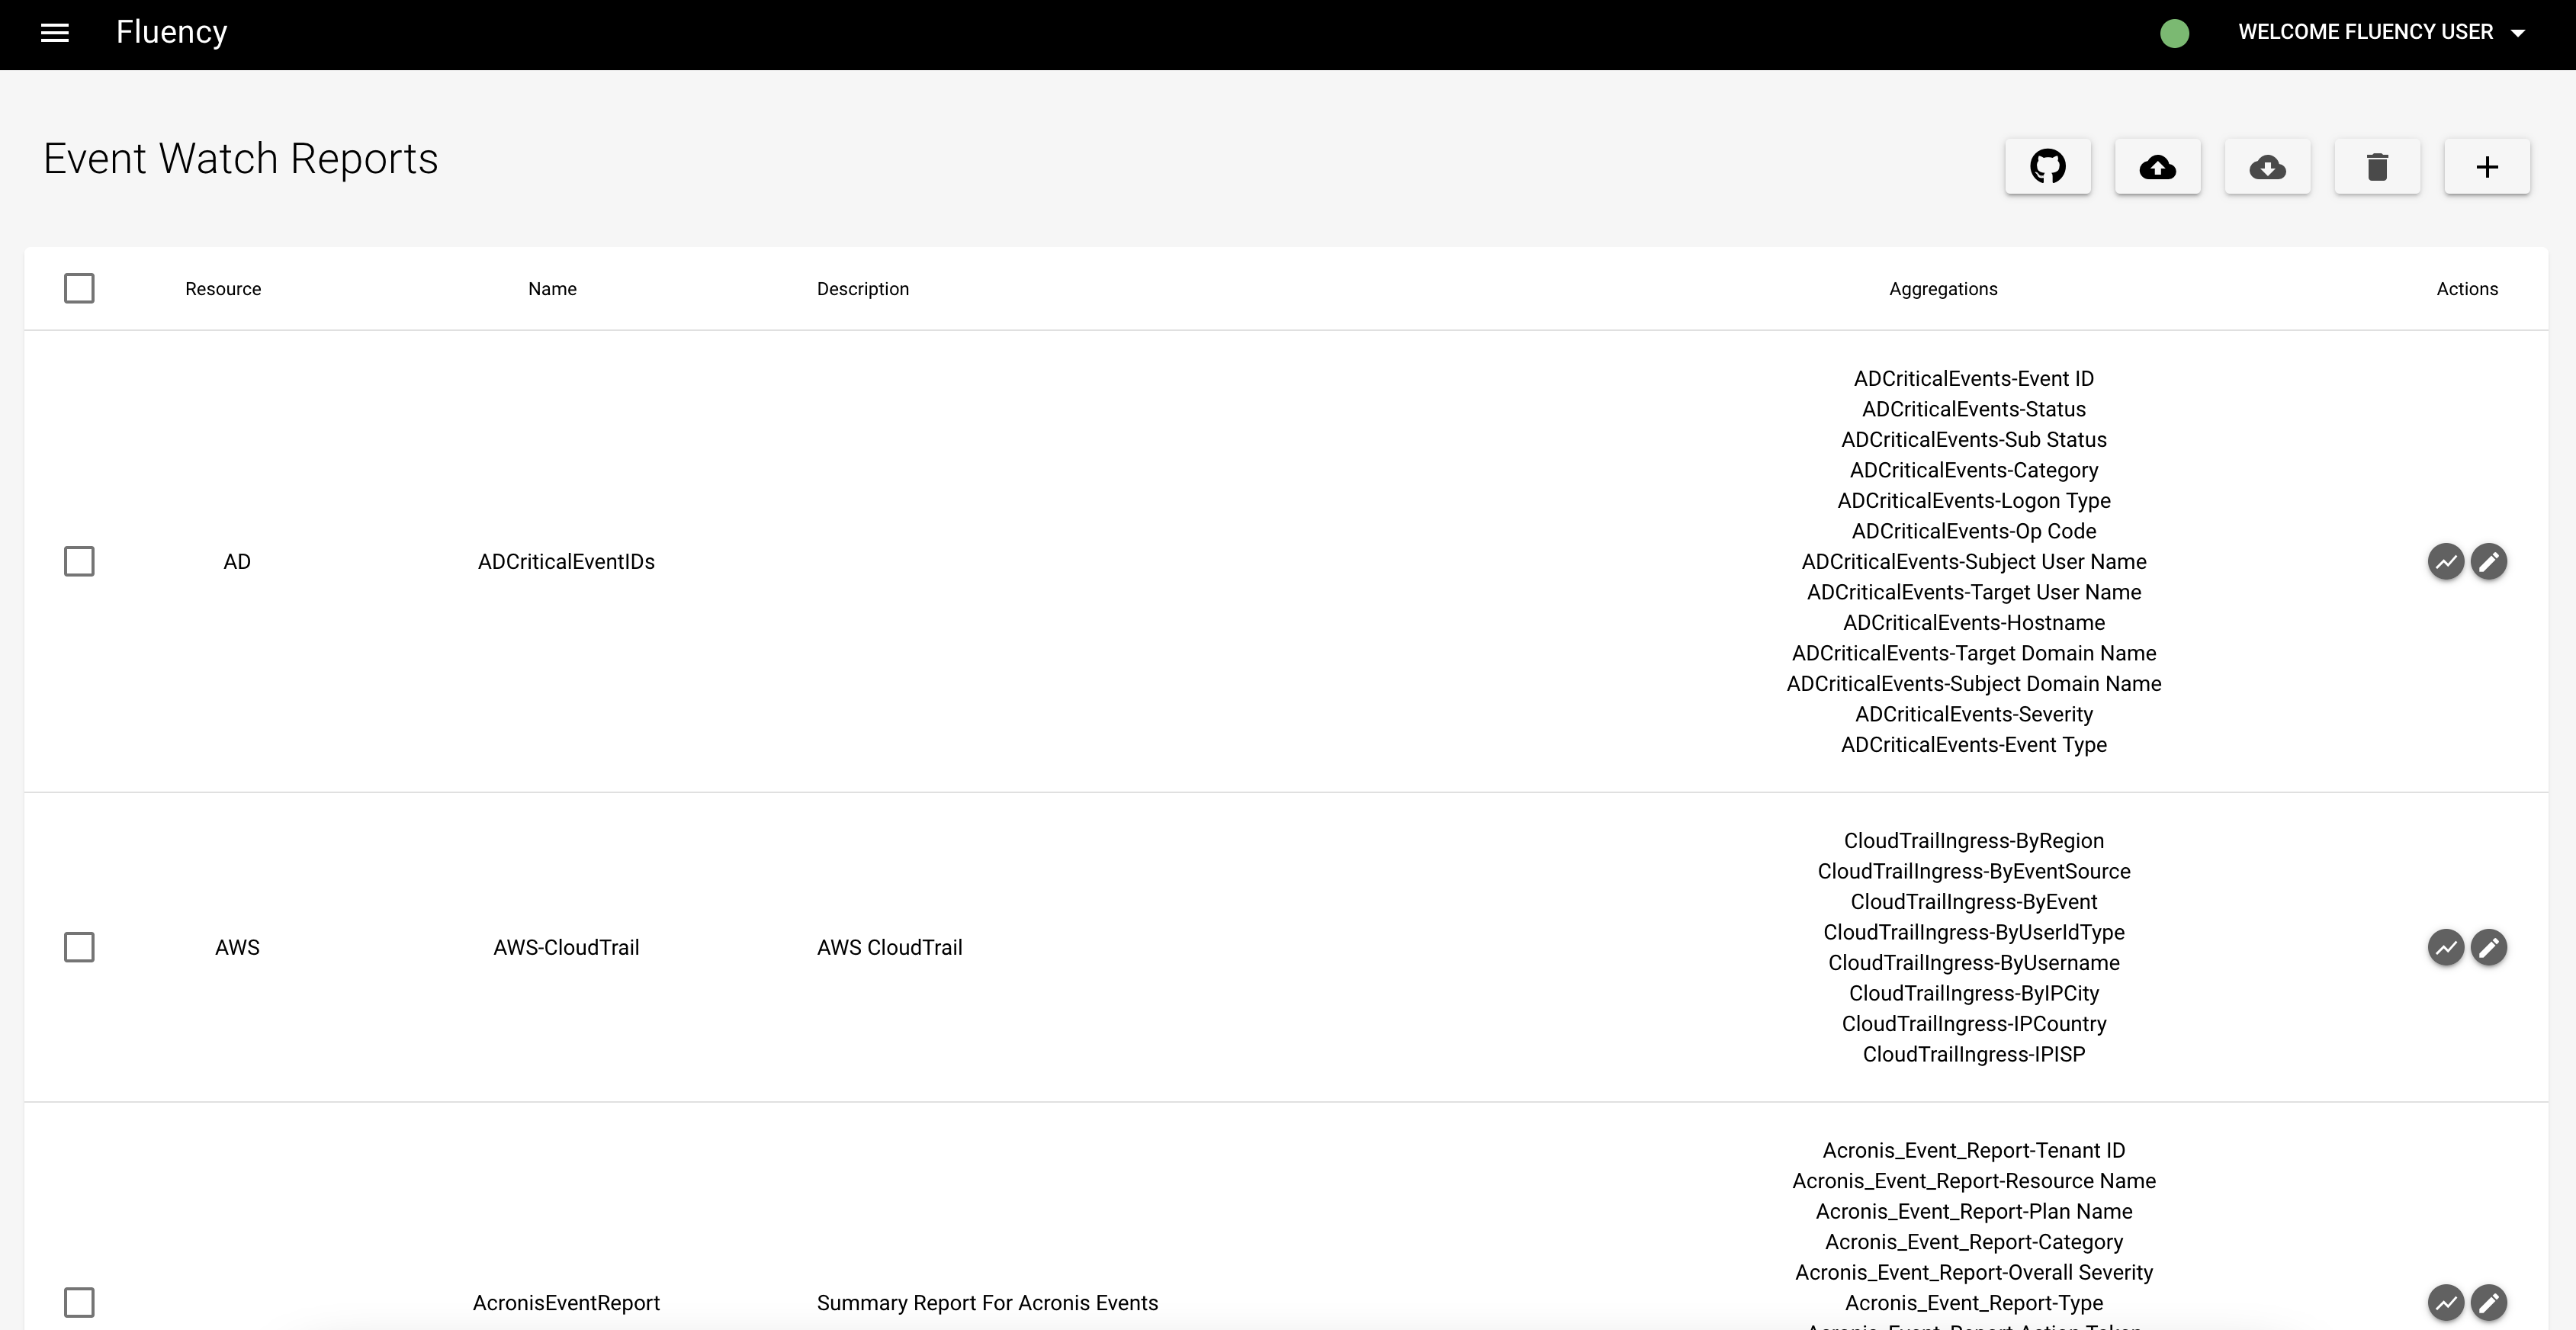
You’ll see the information of existing reports listed in a table, including name, description and agggregations. To add a new report, click the “+” icon.
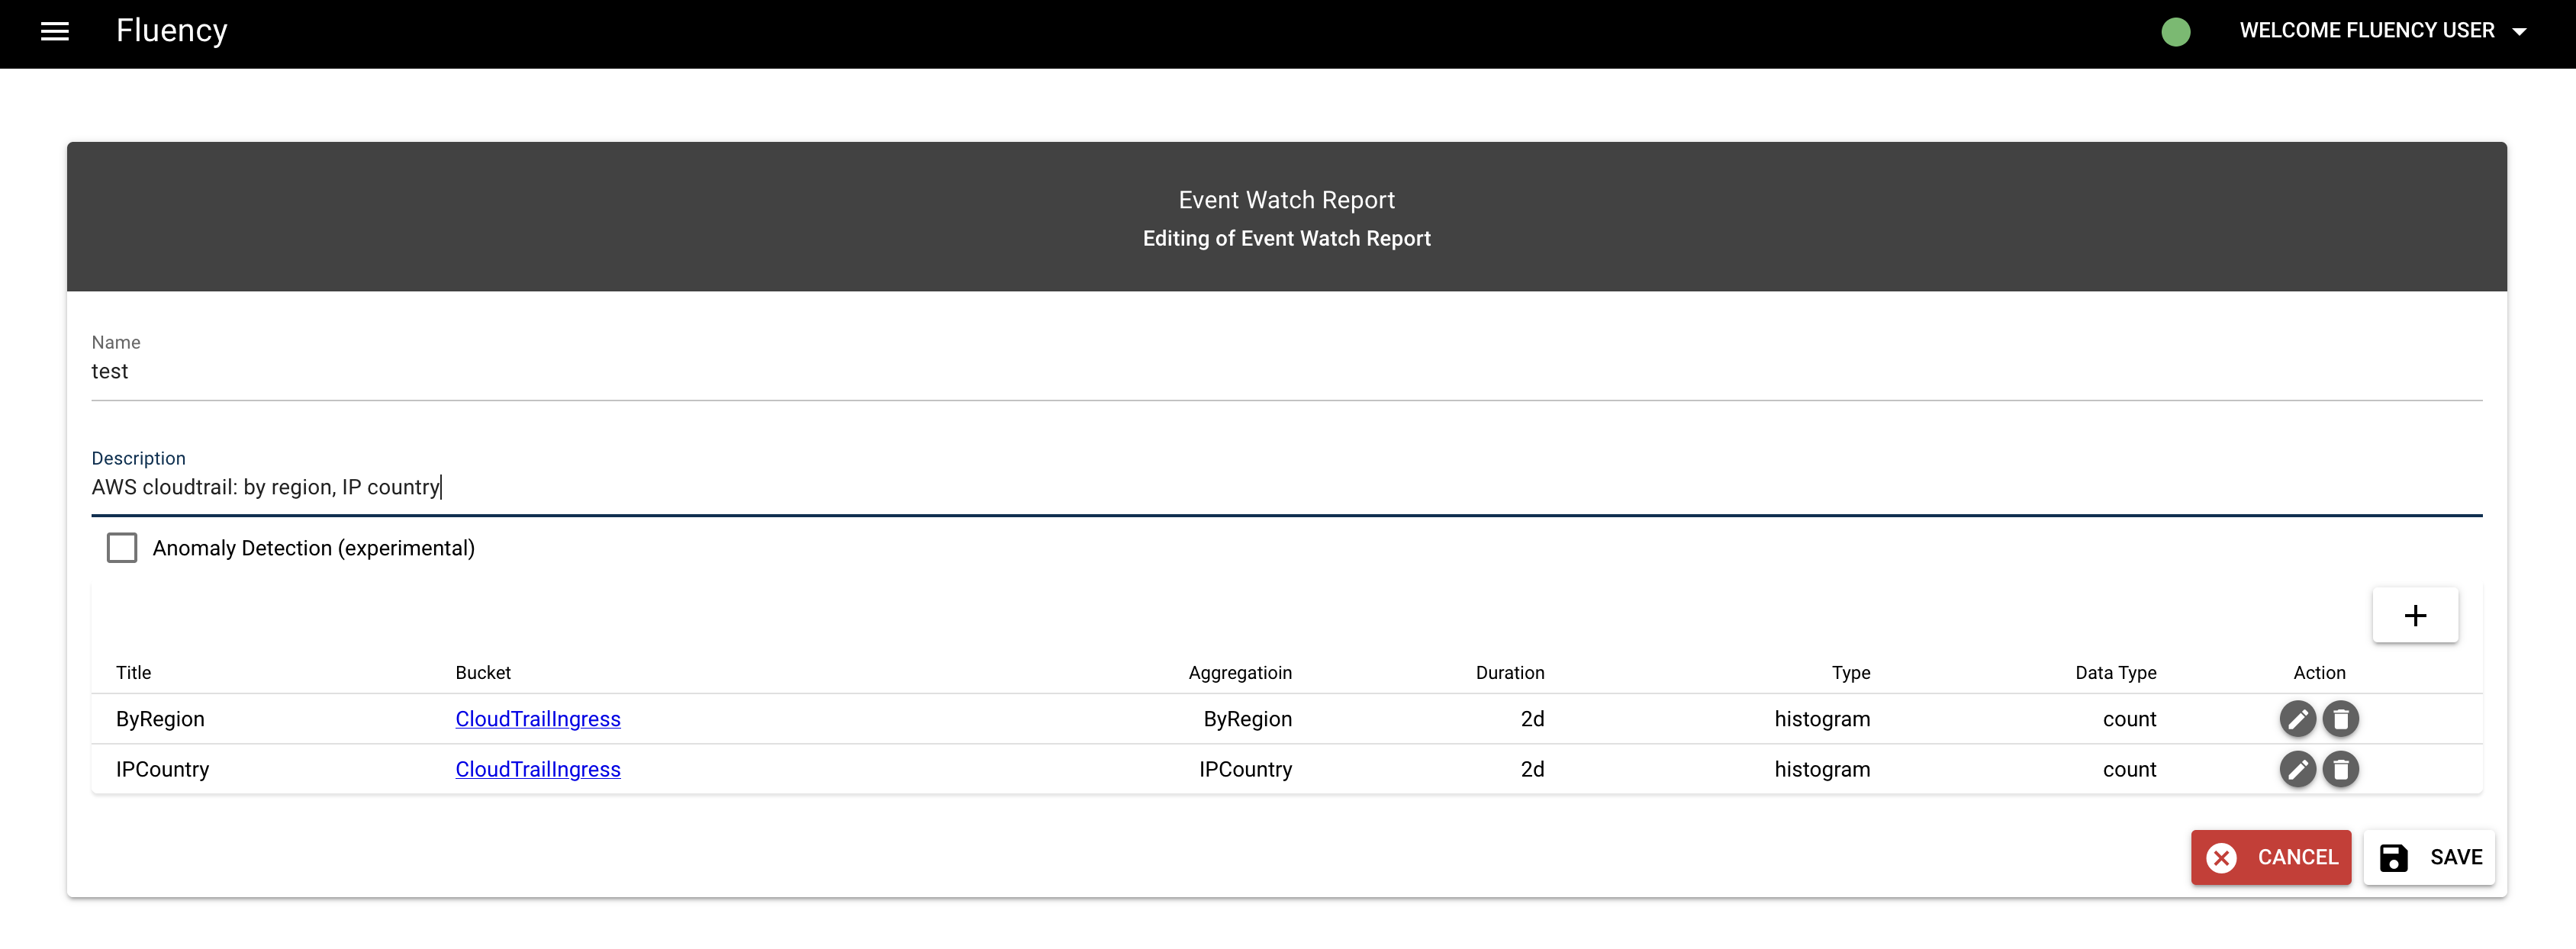
In the pop-up window, fill out the information needed to configure a report. As an example, we will make a report containing some event buckets of AWS cloudtrail. Give the report a name and description. In this case, the name of the report is “test” and description is “AWS cloudtrail: by region, IP country”.
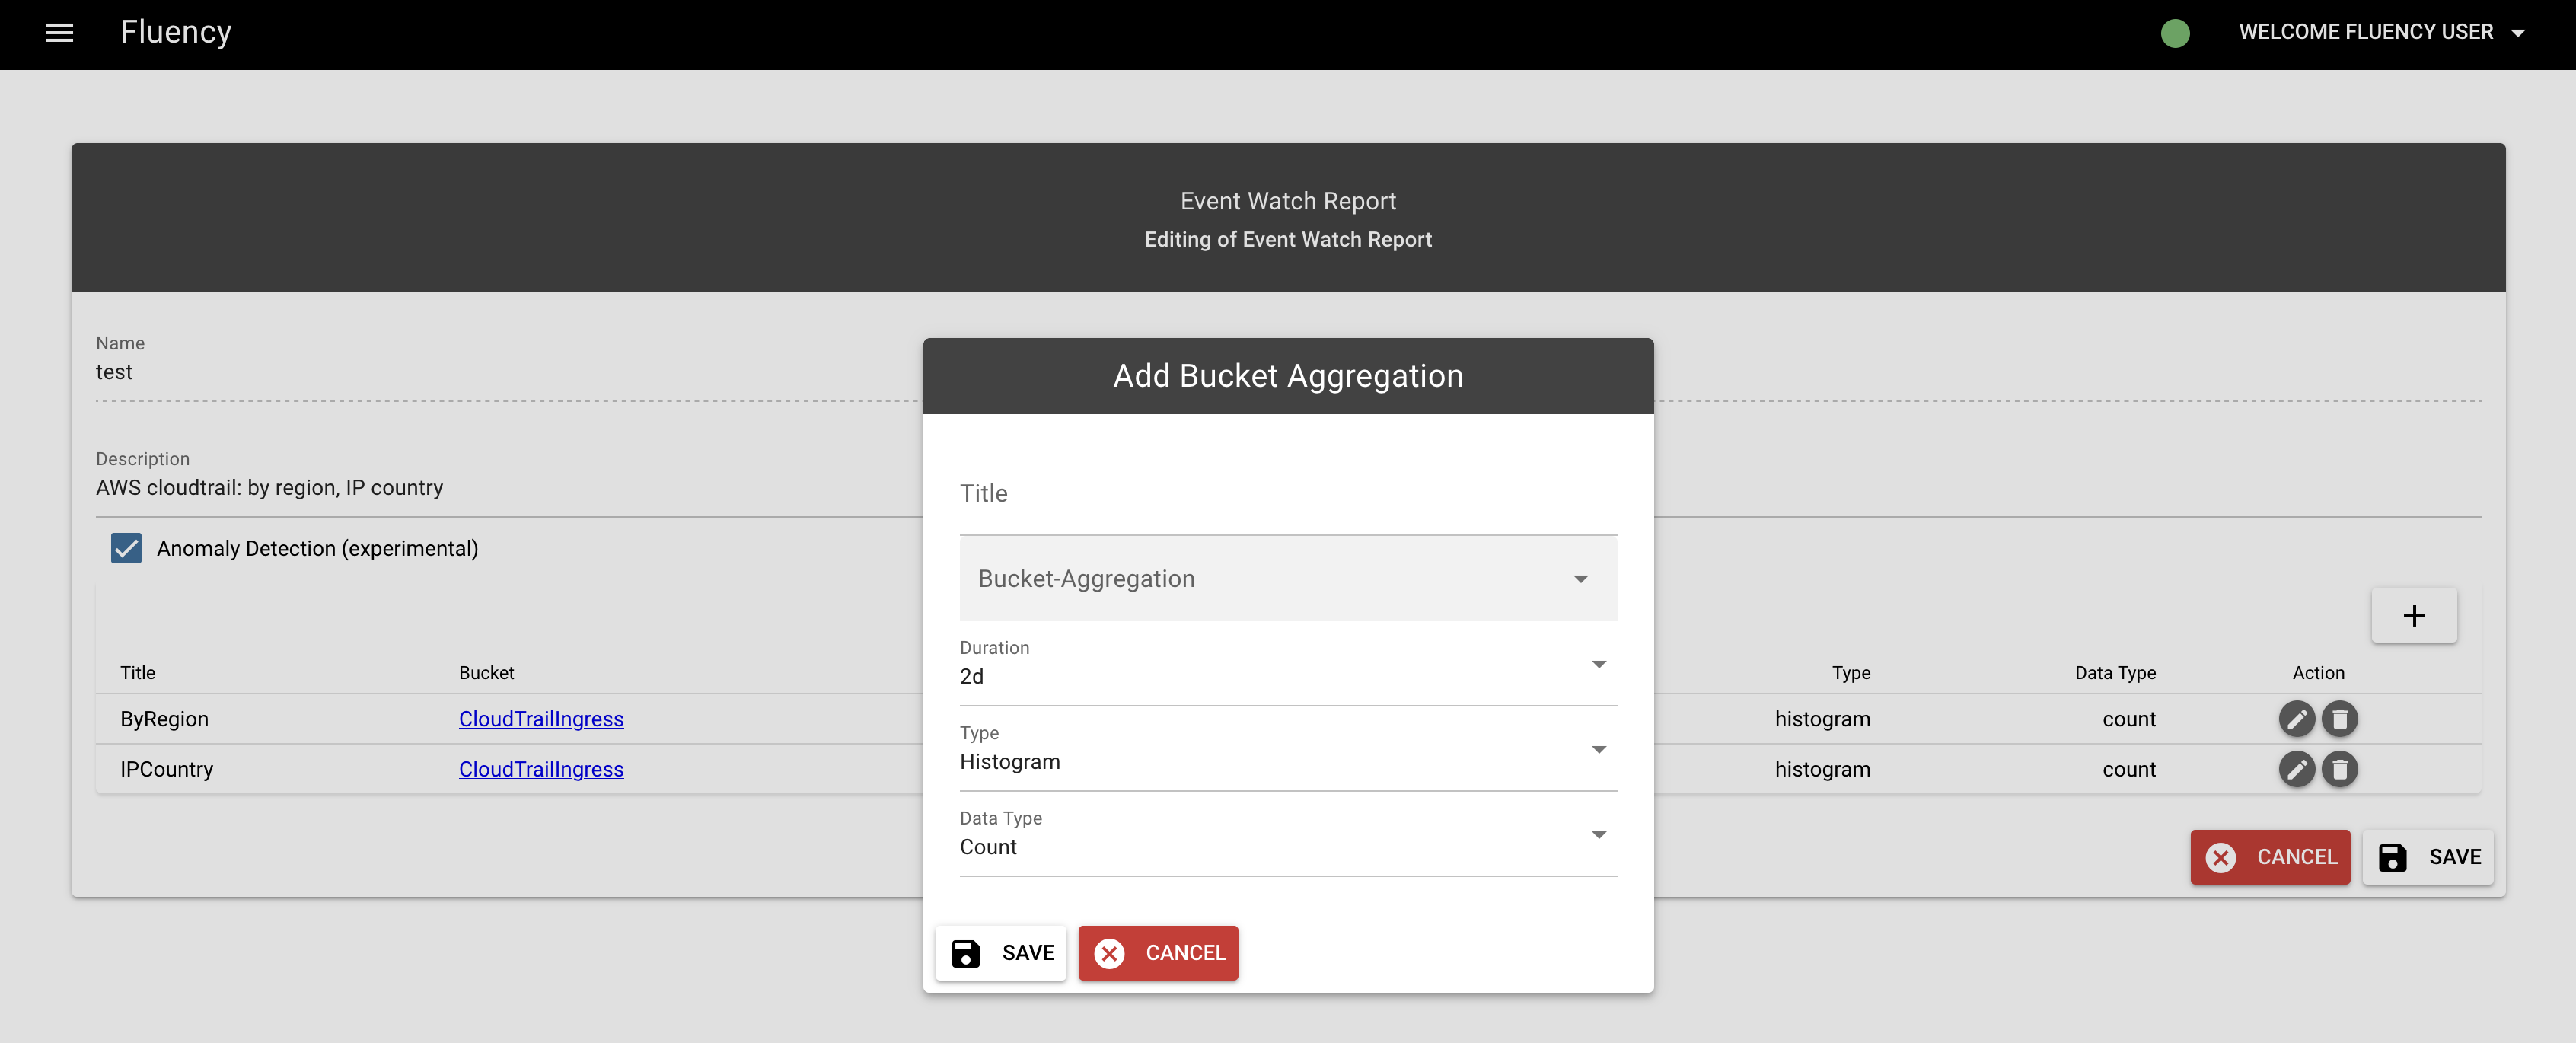
To add aggragations, click the “+” icon in the middle of the table. This will open a drop-down menu containing all the configured buckets from the Event Watch page. Typing in the field will search through the buckets for matches. Since we are creating a simple AWS cloudtrail report, we will select the “ByRegion” and “IPCountry” buckets from the list. After selecting the bucket, the duration (time range) and graph type can be set. The default duration is two days. In this case, we want a histogram of the bucket. Press “SAVE” to add the aggregation.
The trash can icon under the “Action” column to the right of the table allows the user to delete any unwanted aggregations. Add as many aggregations as desired, following the same process as above.
Press “SAVE” on the right bottom corner of the table to save the report.
Then, you’ll be back to the list of existing reports. Scroll down to the latest record, the report now appears in the table.
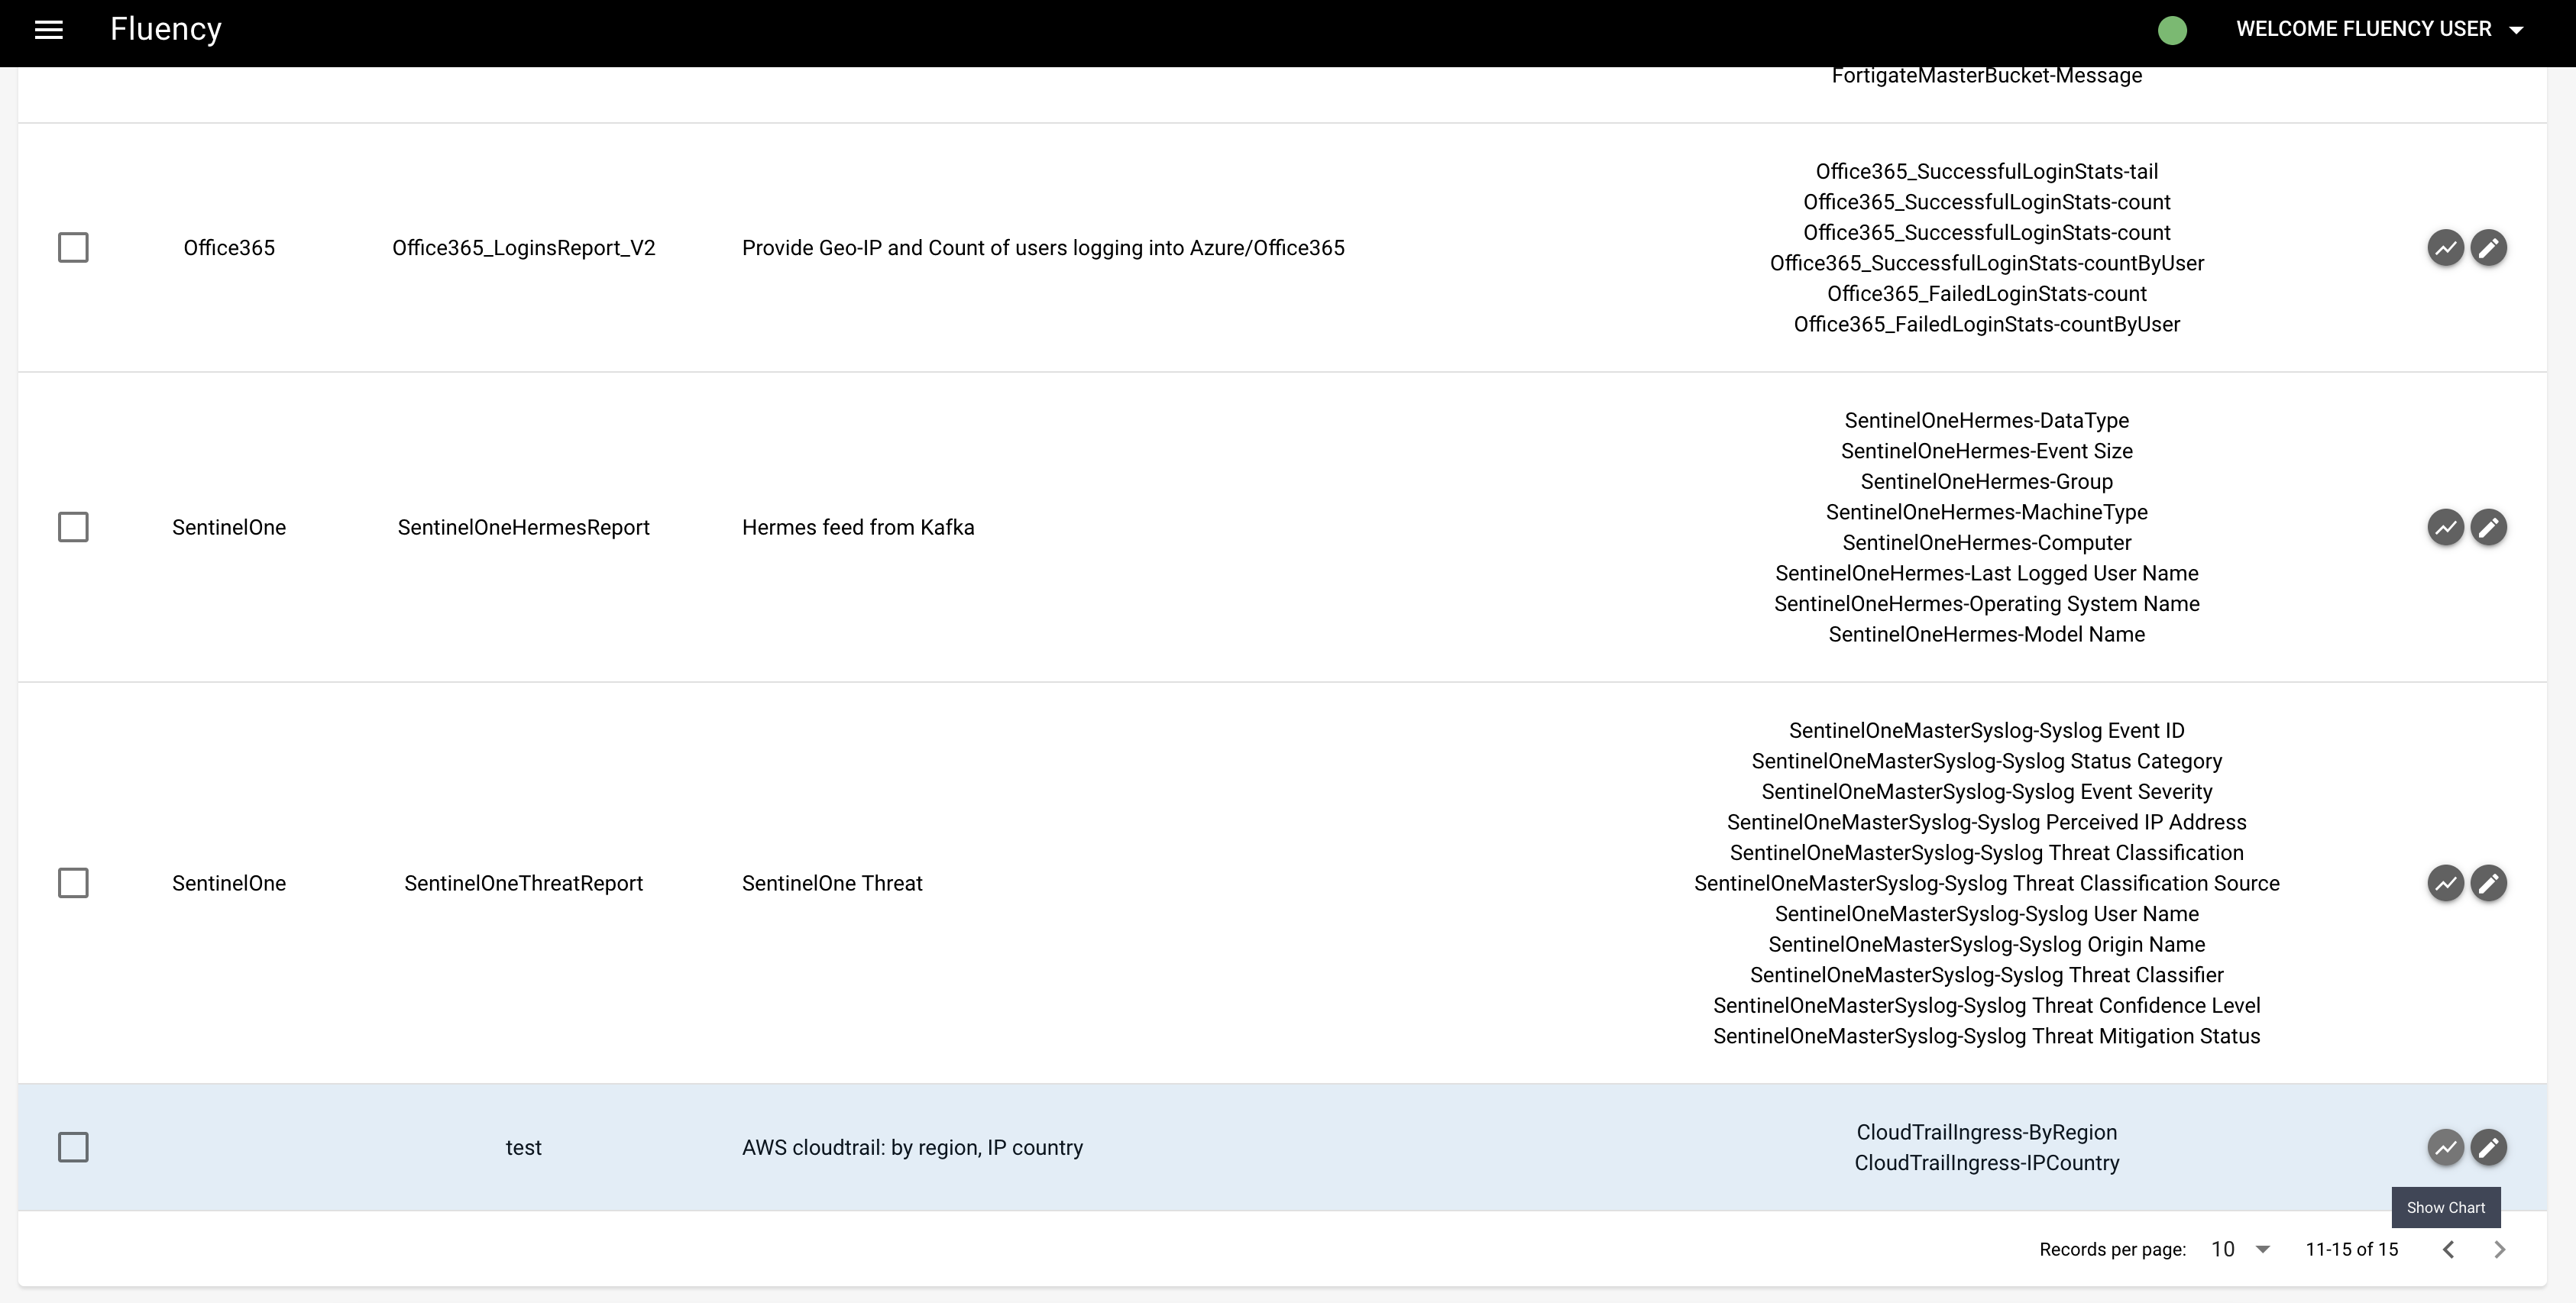
Click the graph symbol in the action column to return to the Reports page.
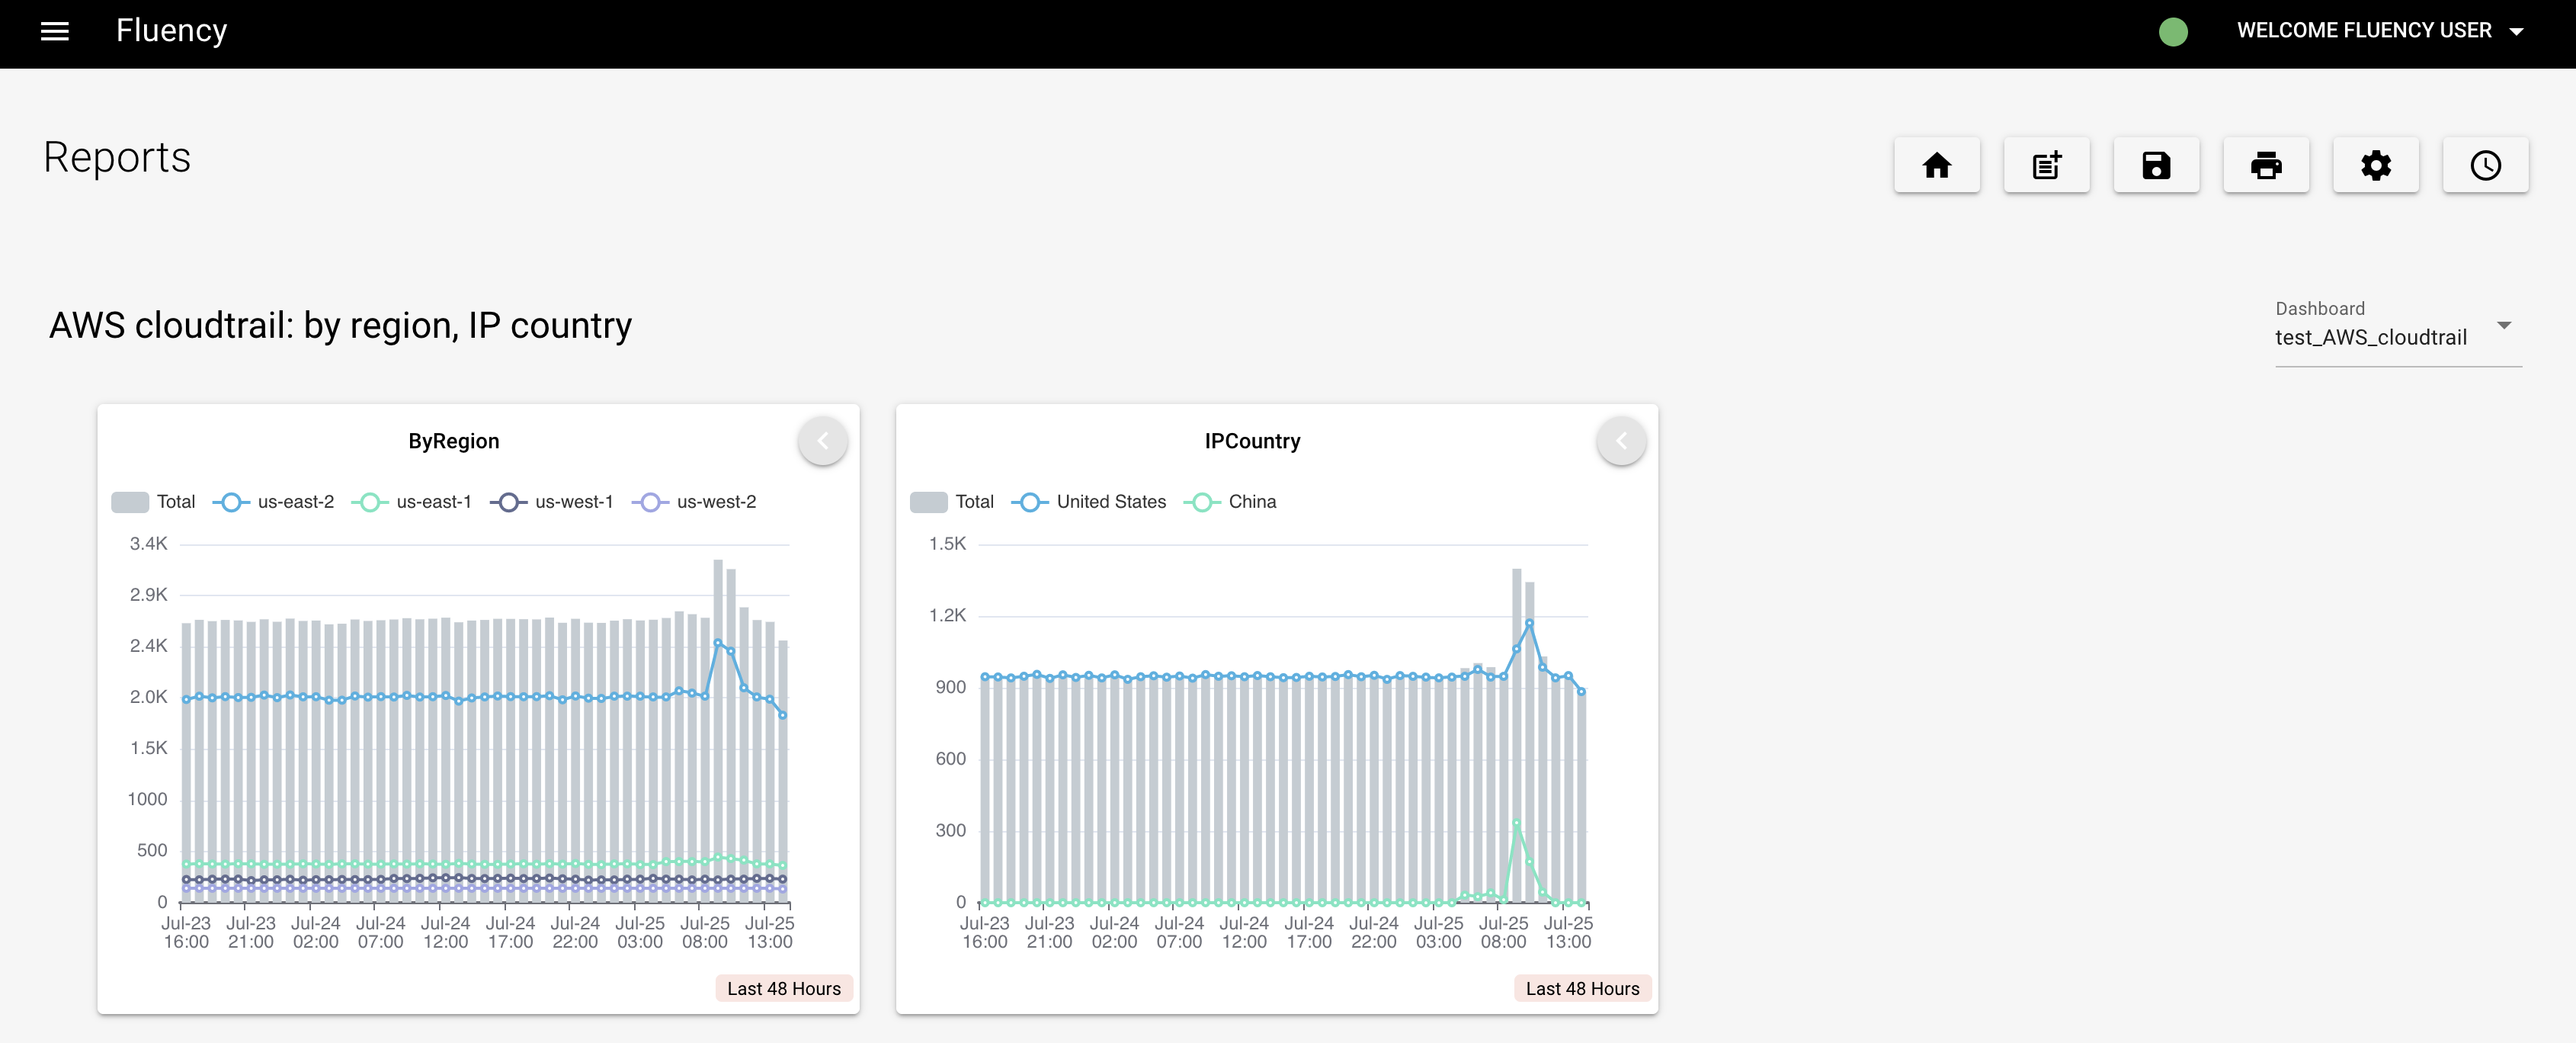
The histograms of event count by region and IP country now appear in this report. As shown at the top of the page, many reports can be defined in order to allow the user to group graphs in any way desired.
Page last updated: 2023 Aug 09